Influencer Marketing ROI: Benchmarks and How to Measure It

What is a good influencer marketing ROI in 2026? Real benchmarks, the formula, a worked campaign example, and why most brands calculate it wrong.
Every influencer marketing manager has a version of the same meeting. You bring a number to leadership, someone asks how you got it, and the honest answer involves a promo code, a spreadsheet, and maybe even a shrug.
Your spend deserves better. Brands put $37 billion into creator content in 2025, up 26% year over year and growing about four times faster than the media industry overall. The same study found that 40% of buyers name overall ROI as their most important KPI. Influencer marketing ROI is now one of the largest lines in a social budget, but also one of the least trusted numbers in a report.
The good news is that influencer marketing is measurable. The reason it so often looks unmeasurable is that most brands count the wrong things on both sides of the equation, which produces a figure that falls apart the moment someone interrogates it.
This guide covers what influencer marketing ROI is, what a good return looks like in 2026, and a 6-step method for calculating a number that holds up in a finance review.
What Is Influencer Marketing ROI?
Influencer marketing ROI is the net return your creator program generates relative to what you spent on it, expressed as a percentage or a multiple.
The formula is the same one finance uses for every other investment:
ROI = (Return − Investment) ÷ Investment × 100
A campaign that cost $50,000 and produced $150,000 in attributed revenue returns 200%. That is straightforward. The difficulty in influencer marketing is never the arithmetic. It sits in two places: deciding what counts as the return, and being honest about what counts as the investment.
Most brands understate both. They count creator fees as the investment and attributed revenue as the return, which leaves out product costs, shipping, paid amplification, tooling, and team hours on the cost side, and leaves out content licensing value, search lift, and retention on the return side. Two errors in opposite directions do not cancel out. They just produce a number nobody trusts.
ROI vs. ROAS
These get used interchangeably and they measure different things.
- ROAS (return on ad spend) divides revenue by spend. A campaign returning $150,000 on $50,000 has a 3x ROAS. It ignores whether you made money.
- ROI subtracts the investment first, so it describes profit rather than gross return. That same campaign has a 200% ROI.
ROAS is the faster diagnostic and it is what most ad platforms report natively. ROI is what finance cares about. You need to report both, and be explicit about which one you are showing, because a 3x ROAS and a 200% ROI describe an identical campaign and sound very different in a board deck.
What Is a Good ROI for Influencer Marketing? 2026 Benchmarks
The truth is that there is no single credible industry average, and you should be suspicious of any page that gives you one to two decimal places.
Benchmark numbers to stop quoting
A few stats dominate search results for this topic, and all of them are outdated:
- "$6.50 for every $1 spent" comes from a Tomoson survey of 125 marketers that Adweek covered in March 2015. Nothing beyond the sample size was ever published.
- "The top 13% of brands earn $20 or more per $1" and "70% of companies earn at least $2 per dollar invested" come from that same 2015 survey.
- "$5.78 per $1 spent" comes from a 2020 benchmark report that measures earned media value, not revenue, which makes it a modeled equivalence figure rather than true return.
If an ROI guide leads with any of these, it’s recycling numbers from years ago. Quoting them in a board deck is risky, because the moment someone traces the source, every other number in your report gets a second look.
The ROI benchmarks worth citing
The most credible benchmark comes from econometric modeling rather than a marketer survey. An analysis of 220 campaigns from 144 brands across 36 sectors and 28 markets scored influencer marketing against every other channel in the media plan, using an index where 100 is the all-channel average.
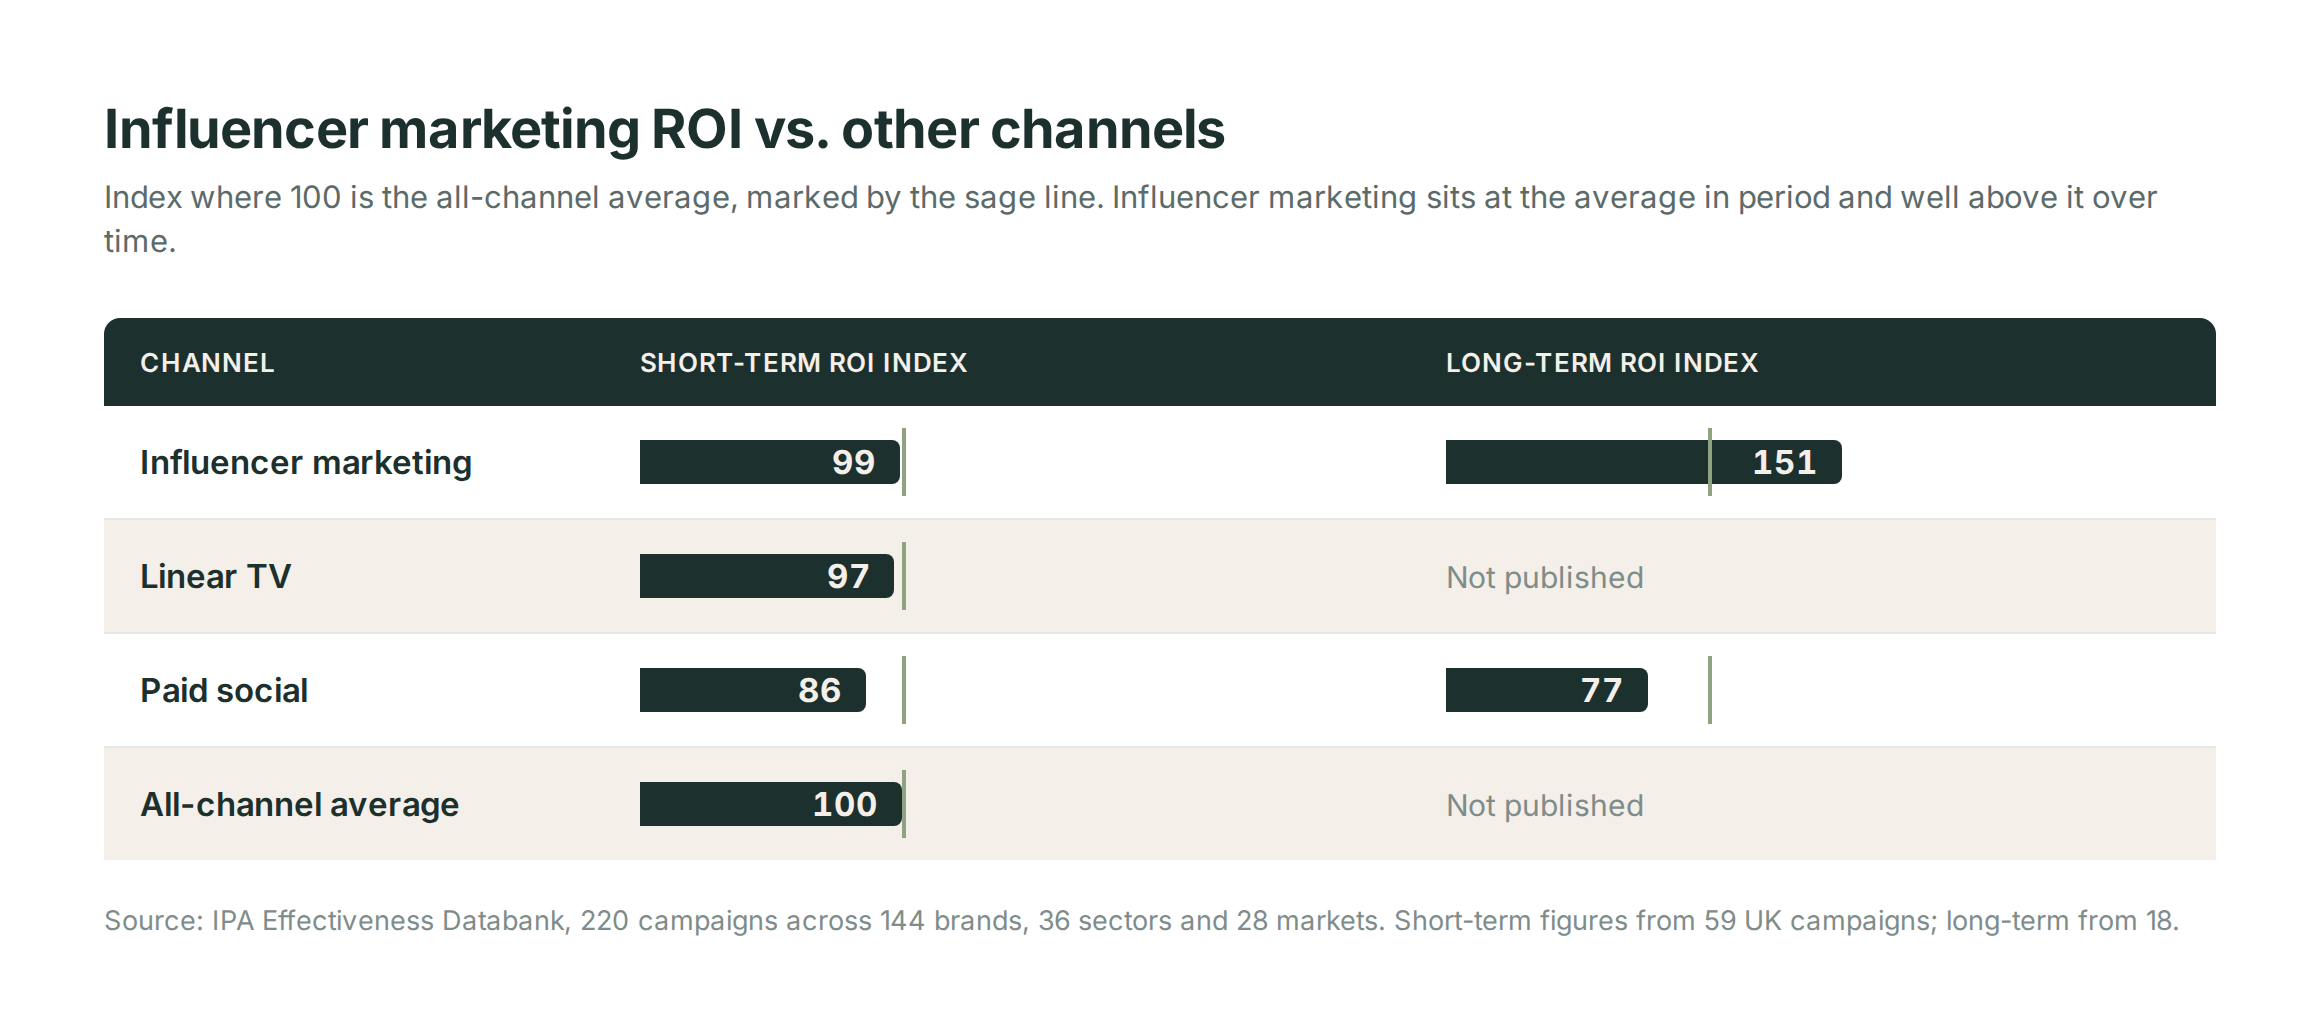
The data shows that influencer marketing performs like an average channel in the weeks right after a campaign runs. But over a longer horizon, it climbs well above that benchmark while paid social falls further below it, ending up at roughly double paid social's score and showing the longest-lasting payoff of any channel measured. In other words, creator content keeps working long after a campaign ends, yet most brands stop measuring before that shows up.
No credible source publishes a reliable average return multiple, which is a large part of why the 2015 figures have survived as long as they have. Generally, 2x is the floor a competent program should clear on attributed margin, 3x is a strong result, and anything above 5x deserves a hard look at your attribution before you celebrate. Outsized numbers usually mean a promo code is absorbing credit for purchases that were going to happen anyway.
ROI by creator tier
Follower count and engagement move in opposite directions, and Aspire's platform data shows the gradient cleanly at every tier:
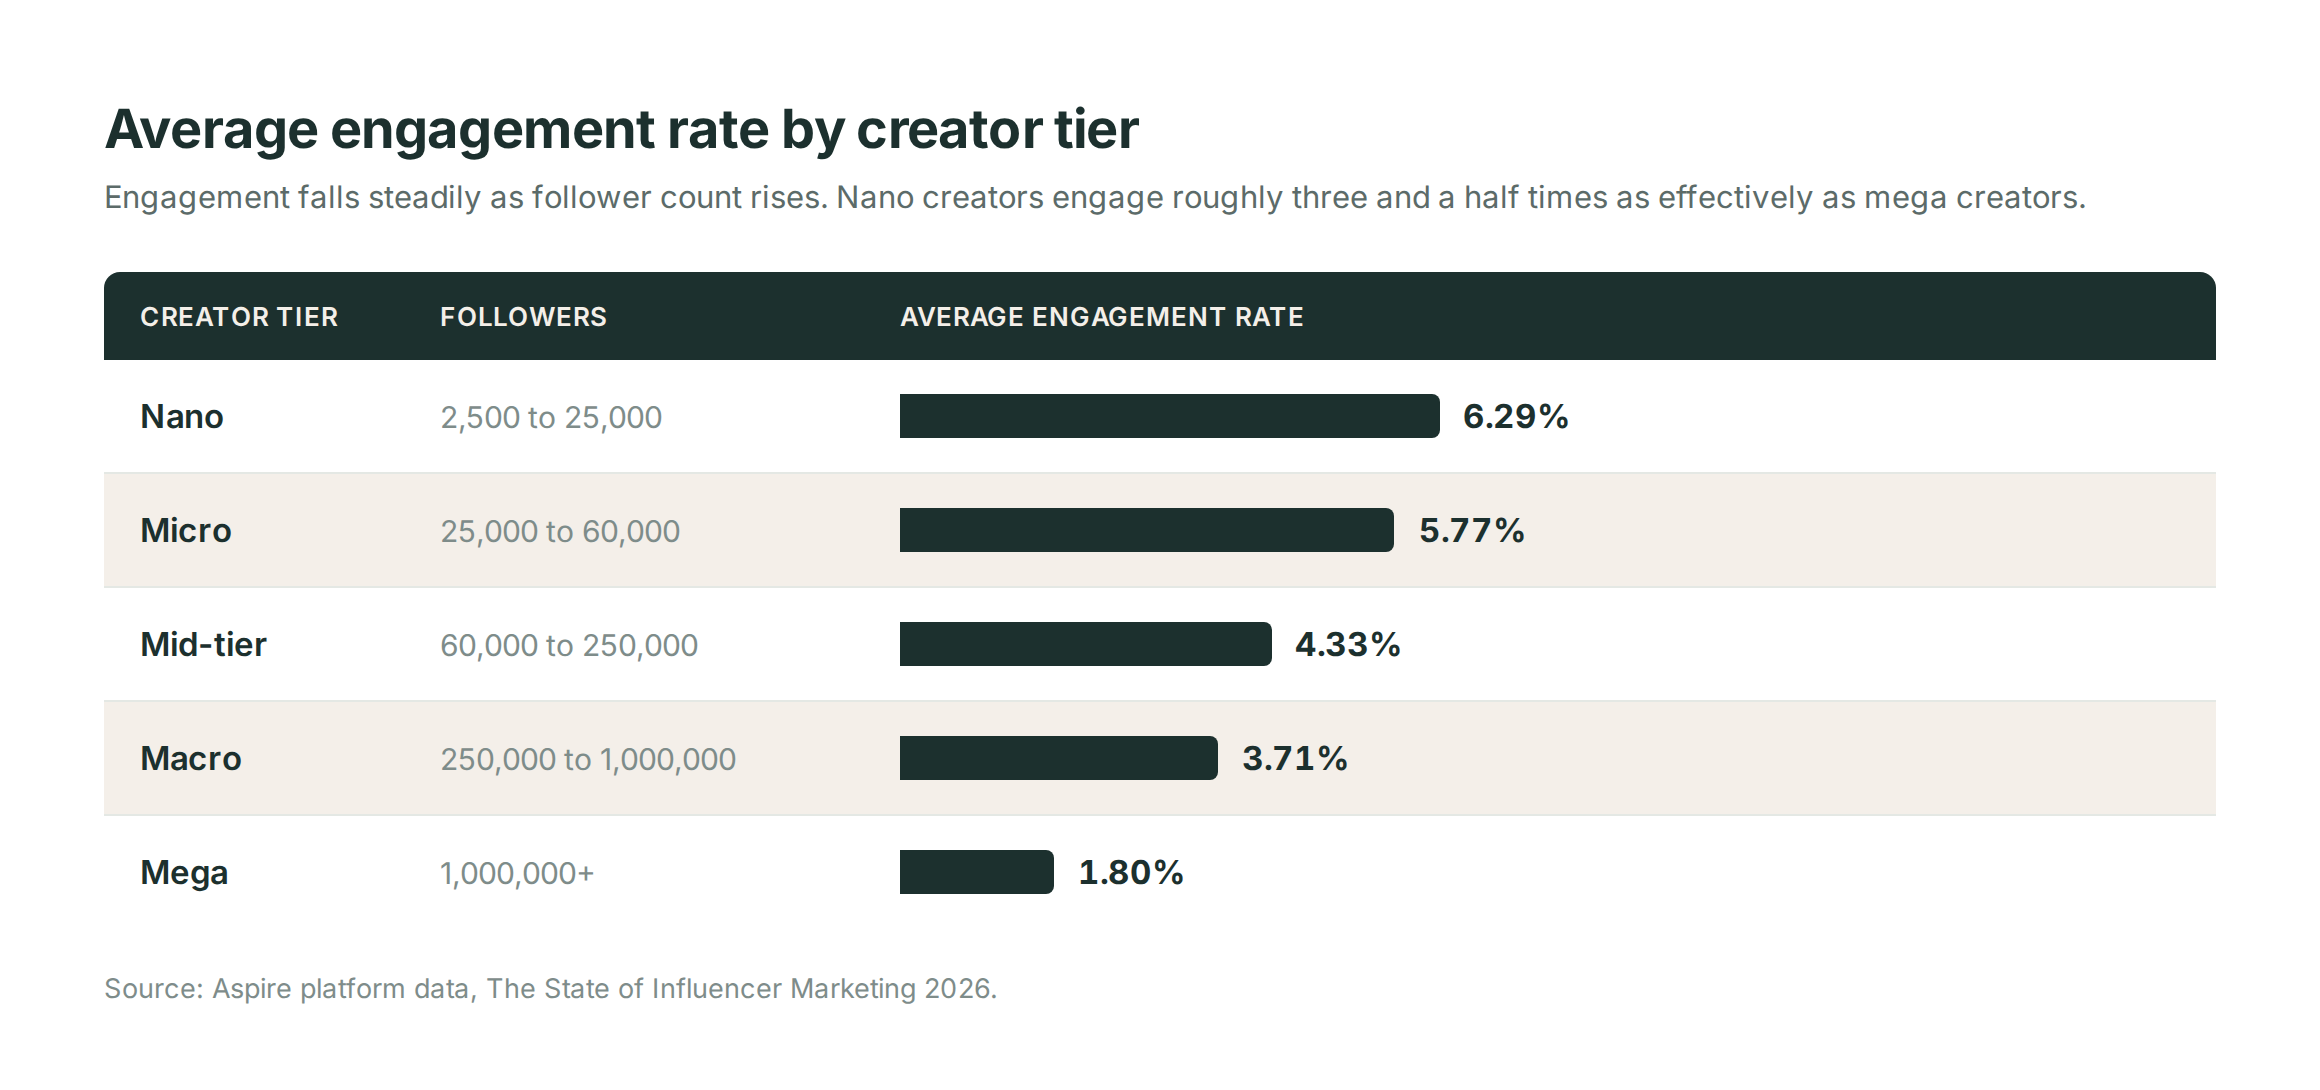
Nano creators achieve roughly 3.5 times the engagement rate than mega creators. Higher engagement does not automatically mean higher ROI, though. Nano programs carry more operational cost per dollar of spend, since 40 creators at $500 each take substantially more coordination than four at $5,000. Factor that labor into your investment line.
That tradeoff shows up in where budgets actually land. 54% of marketers work primarily with nano and micro creators, while 32% now lead with mid-tier, which pairs a strong 4.33% engagement rate with reach that smaller creators cannot deliver. Macro and mega creators still earn their place on mass-awareness pushes and high-profile moments, where the job is reach rather than efficiency.
How to Measure Influencer Marketing ROI in 6 Steps
Step 1: Define the return you’re measuring
Before any tracking gets set up, decide which outcome the campaign is accountable for. The 4 common goals each need to be measured differently:
- Direct sales: Attributed revenue, or better, attributed contribution margin
- New customer acquisition: Cost per new customer acquired, compared against your blended CAC
- Content production: The cost you avoided by not producing the assets in a studio
- Awareness and consideration: Brand lift measured against a holdout, not impressions
Write the target down before launch. Retrofitting a goal to whatever the data ended up looking good at is the most common way ROI reporting loses credibility internally.
Step 2: Count every cost, not just creator fees
Your ROI calculation should account for the complete investment line, which includes:
- Creator fees, including any performance bonuses paid out
- Product cost at COGS, for everything gifted or sent for paid work
- Shipping and fulfillment on those sends
- Content usage rights upcharges. Median upcharges run 25% on top of base rate for one month of digital usage and at least 50% for perpetual rights.
- Paid amplification behind creator content, whitelisted ads, Partnership Ads, and Spark Ads
- Platform and tooling costs, prorated to the campaign
- Agency or managed service fees
- Internal team hours, at loaded salary cost
Step 3: Set up attribution before launch
Attribution you bolt on mid-campaign produces partial data that’s not accountable. Promo codes remain the most widely used tracking method at 45.9% adoption, followed by affiliate links at 26.0% and native shop features at 25.0%.
Use more than one, because each has a specific failure mode:
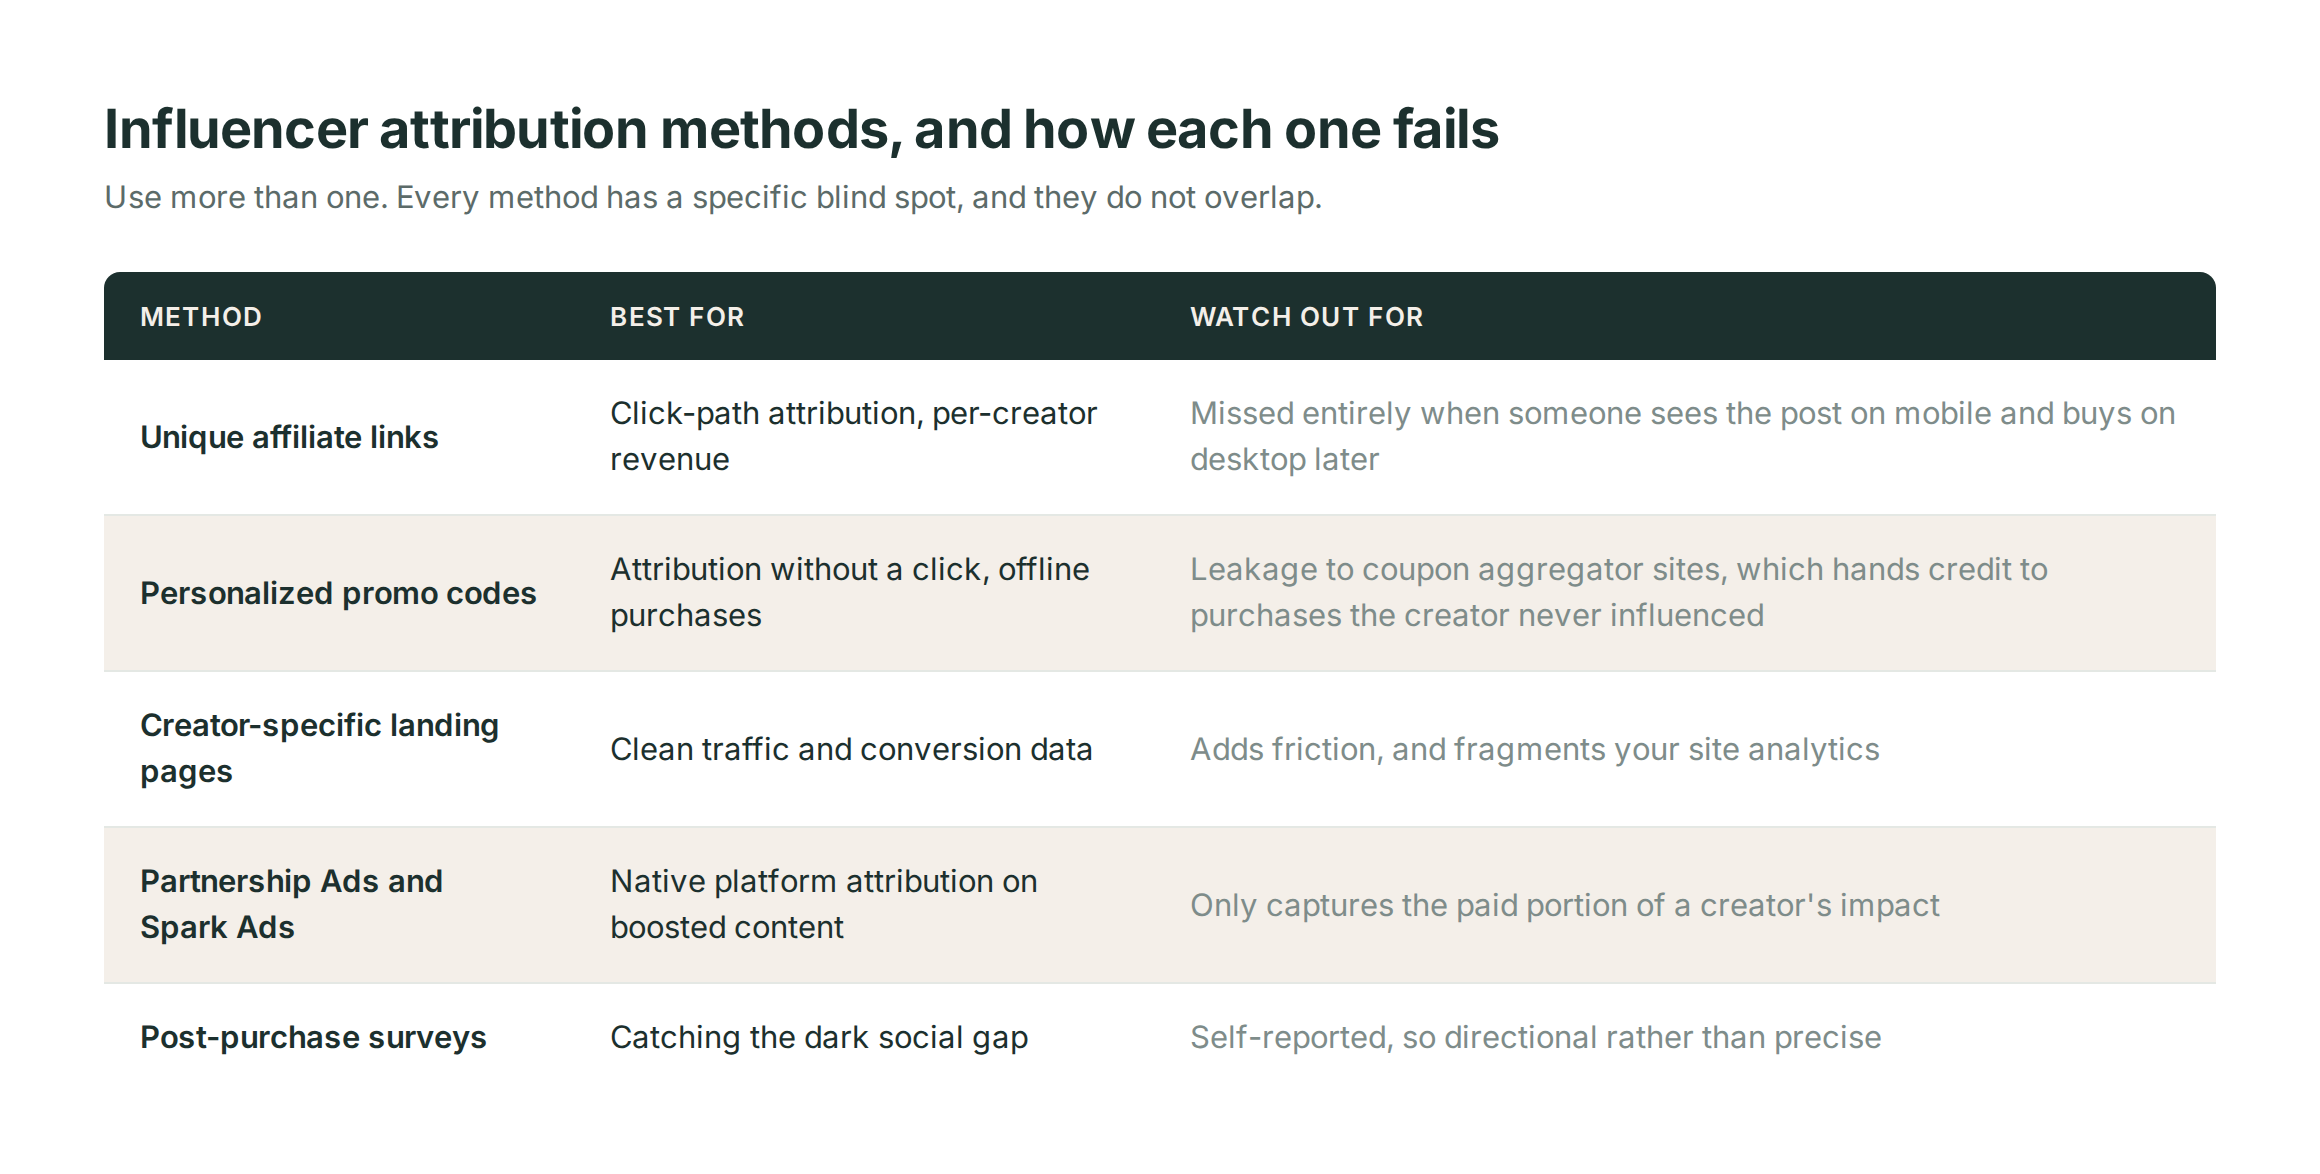
When it comes to promo codes, give every creator a unique code rather than a shared campaign code, and monitor your codes on aggregator sites. A leaked code that ends up on a deals forum will show a spectacular ROI while telling you nothing about the creator.
For a deeper walkthrough of getting tracking right on a specific platform, see our guide to tracking Instagram influencer performance and ROI.
Step 4: Calculate ROI on Margin, Not Revenue
Nearly every influencer ROI guide computes the return on revenue. Finance does not evaluate channels that way, and the gap between the two numbers is large enough to change decisions.
Revenue-based ROI ignores three things that come straight out of the return:
- The discount itself. A 20% promo code means the revenue you attributed arrived at 80% of full price.
- Cost of goods sold on everything you shipped.
- Returns. Apparel and beauty return rates routinely run double digits, and a returned order is revenue you booked and then gave back.
Run the calculation on contribution margin instead.
Step 5: Validate with an incrementality test
Attribution tells you which touchpoint got credit. Incrementality tells you whether the sale would have happened anyway, which is the question your CFO is actually asking.
Here’s a workable geo holdout test, for brands with enough volume to support one:
- Split your addressable market into two matched geographic sets. Match on historical sales volume, growth trend, and seasonality, not just population.
- Hold out 20% to 30% of the market. Smaller than that and the lift disappears into noise.
- Run for at least two full purchase cycles, or eight weeks minimum. Categories with long consideration windows need considerably longer.
- Measure total category sales in each set, not attributed sales. The entire point is to catch demand your attribution missed.
- Read the lift against normal week-to-week variance. If your baseline swings 8% week to week, a 5% lift is not a result.
For creator content running in paid, Meta's Impact Test framework offers a lighter version: a control versus treatment design over two to four weeks, allocating 30% of the treatment cell to Partnership Ads with at least five distinct Partnership Ads in the cell to produce a reliable read. We covered the mechanics in our recap of the Meta Performance Marketing Summit.
If your volume cannot support a geo test, a simpler substitute is a pre-period baseline. Measure four to eight weeks of category sales before the campaign launches, then compare.
Step 6: Report it in the language finance uses
Translate your ROI into the four numbers finance already tracks:
- Incremental contribution dollars: Report the actual margin the program added, rather than relying on gross revenue or ROAS.
- Payback period: Track how many weeks it takes until the program covers its own cost.
- CAC, compared against blended CAC: If influencer-acquired customers cost less than your blended average, use that as the argument for more budget.
- LTV to CAC ratio: Creator-acquired customers often retain differently than paid-social-acquired customers, making cohort retention data your strongest case.
Also feed your creator spend into your marketing mix model if you run one. Channels excluded from the MMM get treated as noise during budget planning, which is how well-performing programs lose funding.
A Worked Example: What ROI Looks Like on a Real Campaign
Here is the same campaign calculated three ways. A DTC skincare brand runs 40 mid-tier creators over a 60-day window, licensing content from half of them and boosting a portion into paid.
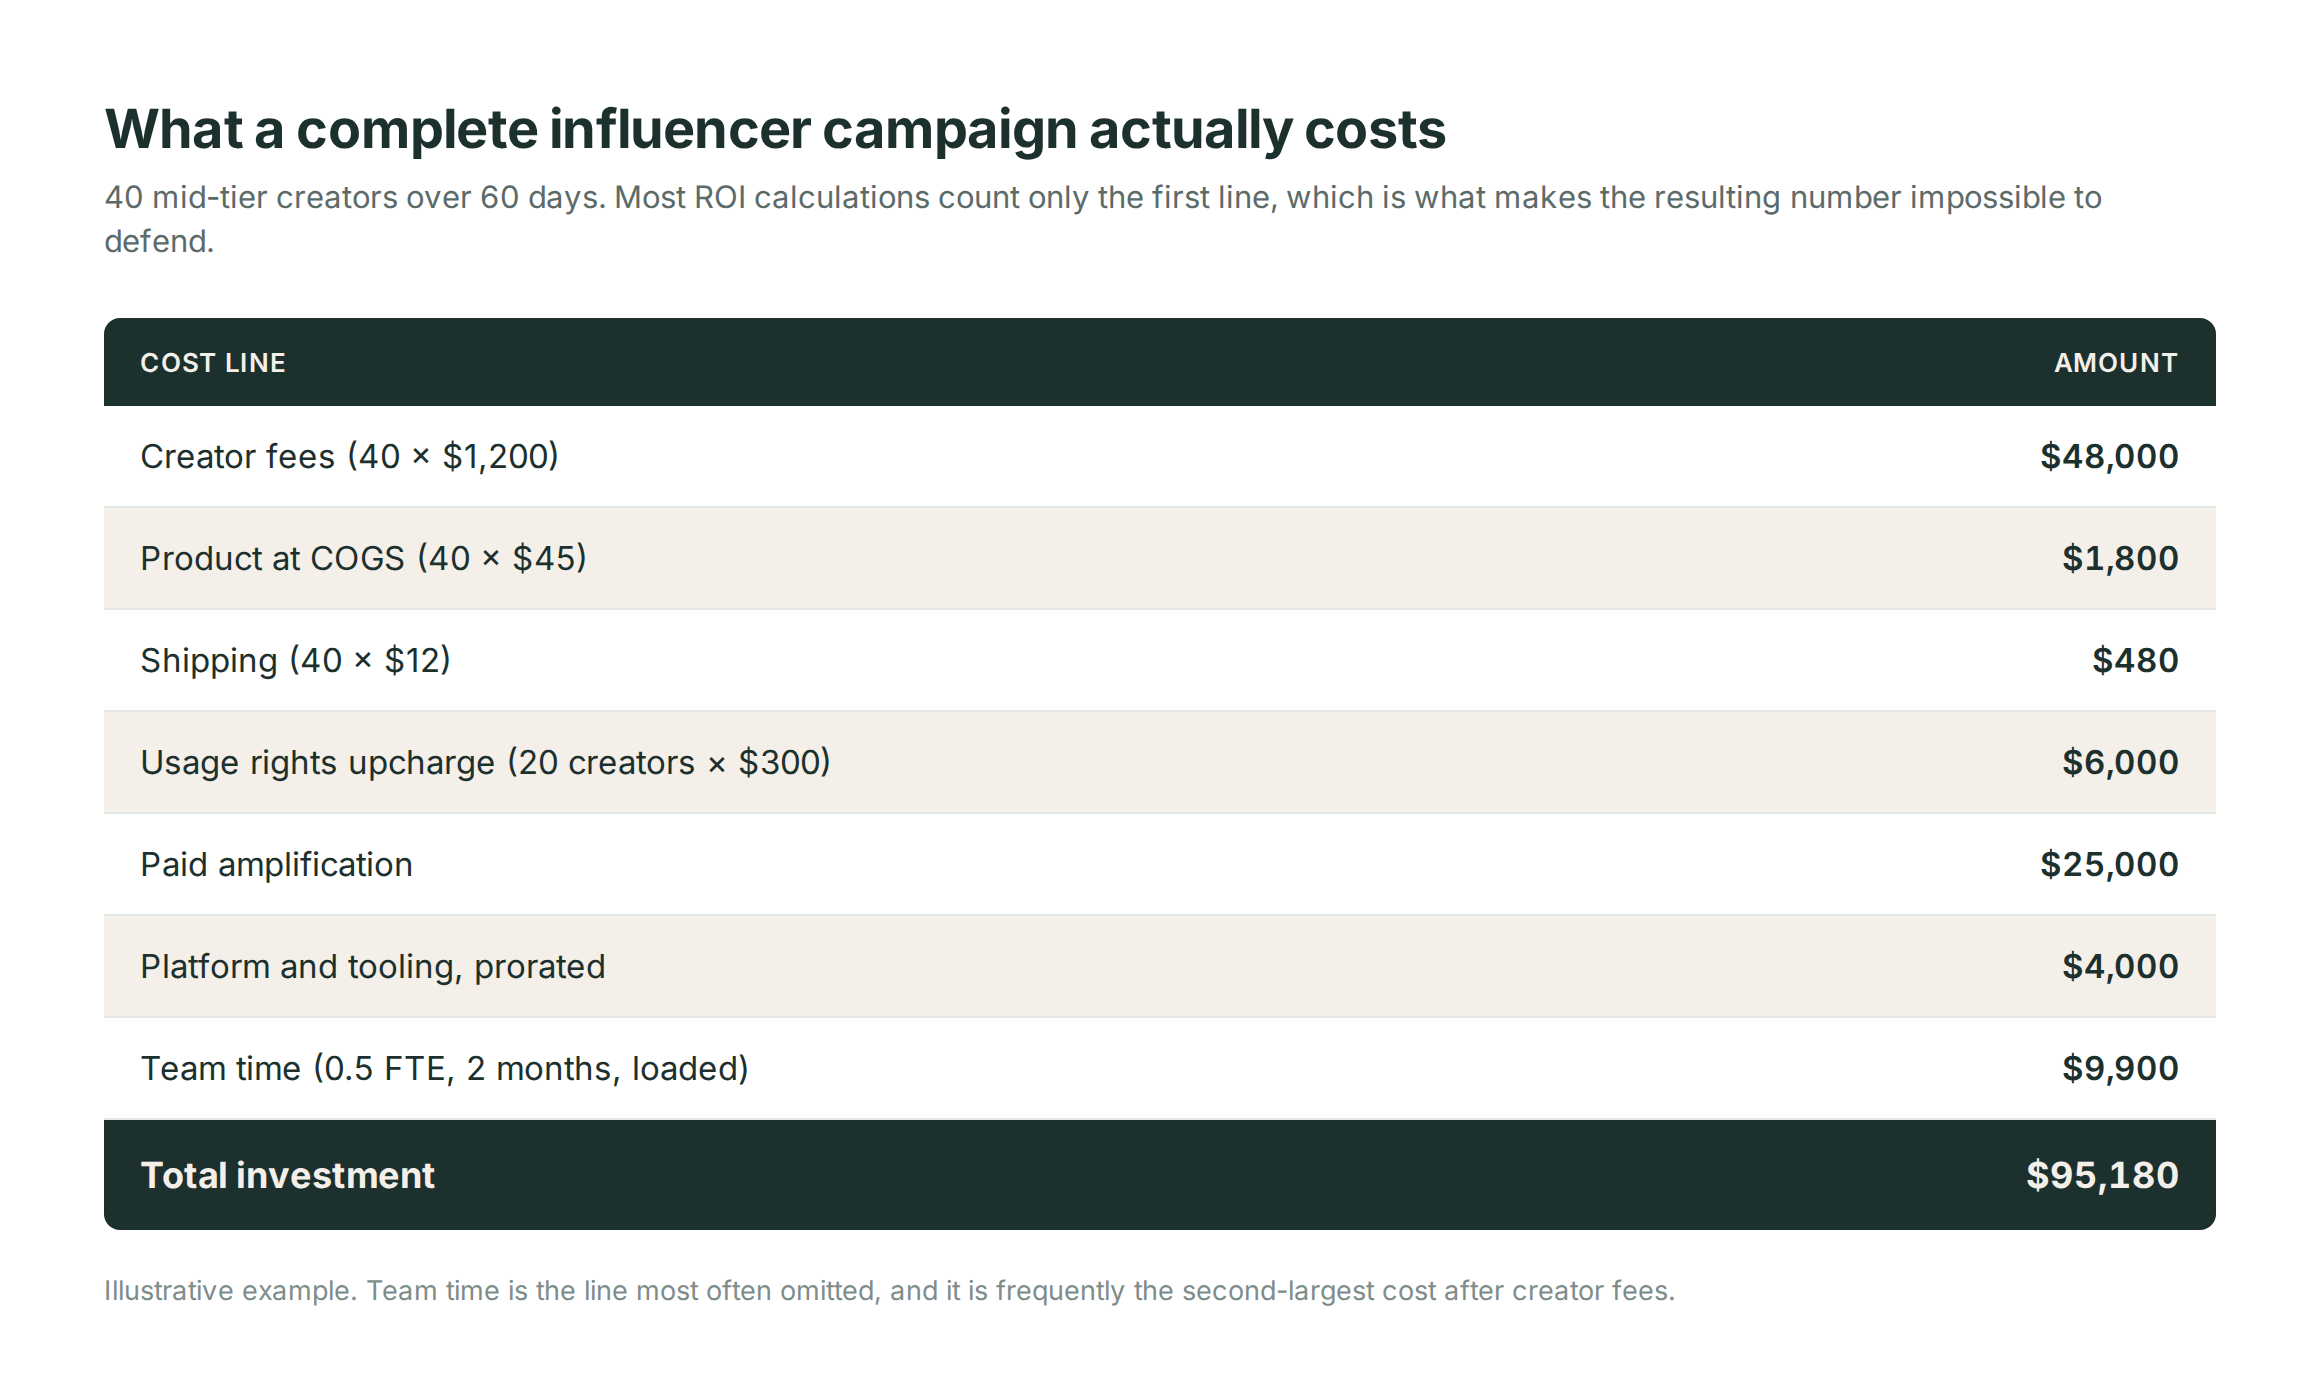
The return, calculated three ways:
The campaign drove $210,000 in attributed revenue.
Version 1, revenue-based. ($210,000 − $95,180) ÷ $95,180 = 120.6% ROI, or a 2.2x ROAS. This is the number most brands would report.
Version 2, margin-based. Strip out a 9% return rate, which leaves $191,100 in net revenue. Apply a 55% contribution margin, which accounts for COGS, the promo discount, payment processing, and fulfillment. That leaves $105,105 in actual margin.
($105,105 − $95,180) ÷ $95,180 = 10.4% ROI
Same campaign. The honest number is roughly one eleventh of the reported one.
Version 3, margin plus content value. The 20 creators the brand licensed delivered 60 usable assets it can run anywhere. Comparable studio production runs about $450 per asset, so that is $27,000 in avoided production cost, which is a real return even though no revenue attached to it.
($105,105 + $27,000 − $95,180) ÷ $95,180 = 38.8% ROI
Version 3 is the most complete picture, and it’s the one to take to finance. Note what this example reveals: this campaign was marginal on sales alone and clearly worthwhile once content value was counted. A team reporting only Version 1 would have drawn the right conclusion for the wrong reason, and a team reporting only Version 2 might have killed a program that was working.
Note also what the licensing line does to the math in both directions. Buying rights from all 40 creators instead of 20 would have added $6,000 to the investment and roughly $27,000 to the return, which is usually the better trade. Rights you did not buy are assets you cannot count.
How to Measure ROI on Gifted and Product Seeding Campaigns
Product seeding has no media cost, which can tempts teams to treat it as “free.” It’s not, and the ROI math is more straightforward than most people assume.
The investment is product at COGS, shipping, fulfillment labor, and the team hours spent on sourcing and coordination. For a 200-creator seeding program at $30 COGS and $9 shipping, that is $7,800 before anyone touches a keyboard.
The return has three components:
- Attributed sales from creators who post with a code or link.
- Content value from usable assets, calculated as production cost avoided. This is usually the largest line in a seeding program.
- Post rate, which is your efficiency metric rather than a return. If only 30% of recipients post, your effective cost per asset is more than three times your per-unit send cost.
Track post rate obsessively, because it is the single biggest lever on seeding ROI. Improving post rate from 30% to 50% cuts your cost per asset by 40% without spending another dollar.
How to Value Creator Content as a Return
If you’re not tracking the value of your creator content, you’re leaving money on the table. A campaign that produces 60 usable assets has generated real value whether or not a single sale is ever attributed to it, and most ROI calculations ignore that line entirely.
There are two defensible ways to value it:
- Production cost avoided: What would this asset have cost from a studio or production agency? Use your own historical rates if you have them, since they are far more defensible internally than an industry estimate.
- Performance in paid: If a creator asset outperforms your brand-produced creative in ads, the value is the efficiency gain, measured as the CPA difference multiplied by the volume you ran through it.
An analysis of $130 million in ad spend across 65,000 ads from 137 brands found that ads carrying a creator's handle drove 19% more clicks, 10% higher conversion rates, and a 5% lower cost per customer than the same ads run from the brand account alone. On Meta search placements the gap widened considerably, to 143% higher conversion and 63% lower cost per acquisition.
Note what that comparison isolates before you quote it. It measures the effect of running an ad from a creator's handle rather than the brand's, which is not quite the same as measuring creator-made creative against studio-made creative. The lift belongs to the format and the endorsement together, not to the content alone.
What that data does justify is running the test yourself. Put creator assets and brand assets in the same campaign with the same budget and audience, and let your own CPA tell you the answer. That number is first-party, defensible, and specific to your brand.
How to Measure ROI on Boosted Creator Content
When creator content runs in paid, the ROI question gets easier in one respect and harder in another.
On the one hand, it’s easier, because platform-native formats attribute cleanly. Partnership Ads and Spark Ads run from the creator's handle, so impressions, clicks, and conversions land against that creator natively rather than needing to be inferred.
On the other, it’s harder, because you now have two spends producing one result, and separating them takes deliberate structure:
- Report organic and boosted performance separately. Blending them makes it impossible to tell whether the creator or the media buy drove the outcome.
- Attribute the media spend to the campaign, not the creator. A creator whose content you put $20,000 behind will look like your top performer on revenue and may be middling on efficiency.
- Use CPA on the boosted content as your creative quality signal. It is the cleanest read available on whether a particular creator's content actually works.
- Hold organic-only creators to a different bar. Comparing an unboosted creator against a heavily boosted one on raw revenue tells you about your media plan, not about the creators.
Our guide to setting up ad-ready creator content walks through the usage rights and account access steps this requires.
Why Last-Click Attribution Understates Influencer Marketing ROI
If you measure your creator program with a last-click model, it will almost always look like it is underperforming, and the model is the reason.
At their 2026 Partner Summit, TikTok said last-touch attribution misses up to 90% of the credit owed to upper-funnel activity. Meta used its own summit to push advertisers away from last-click and toward lifetime value and incrementality.
Creators sit squarely in that missed credit. Picture this: someone watches a creator's Reel about your product, saves it, searches your brand by name a week later, clicks a paid Google result, and converts. Last-click gives the Google ad 100% of the credit. The Reel, which did the work of turning a stranger into a buyer, gets nothing.
Here’s how to avoid this:
- Use a multi-touch or data-driven model for any reporting that informs budget decisions, and keep last-click only as a directional floor.
- Run branded search as a leading indicator. A creator campaign that lifts branded search volume is working, even when the conversions get credited elsewhere.
- Extend your attribution window. Categories with long consideration cycles need 30 to 90 days, and a 7-day window will systematically understate your program.
Aspire's Impact Value metric was built for this problem specifically, translating reach, engagement, awareness, and sales into one figure that survives the attribution gap.
The Metrics That Belong in an ROI Report
Not every metric is an ROI metric. Sorting them into tiers keeps reports focused and keeps vanity numbers out of conversations with leadership.
Tier 1: Business outcomes
These belong in the report to finance:
- Incremental contribution margin
- Attributed revenue and ROAS
- Cost per acquisition, versus blended CAC
- New versus returning customer split
- LTV to CAC ratio by acquisition source
Tier 2: Performance diagnostics
These explain why Tier 1 moved:
- Conversion rate by creator and by content format
- Cost per asset, and post rate on seeded product
- CPM and CPA on boosted content
- Click-through rate on affiliate links and codes
- Branded search lift during and after the campaign
Tier 3: Leading indicators
These are useful for optimization, not for proving ROI:
- Engagement rate, saves, and shares
- Reach and impressions
- Follower growth
- Sentiment
Earned media value deserves a specific caution. EMV converts engagement into a dollar figure using a multiplier you choose, which means it can produce almost any number you want. It is a directional comparison tool at best, and presenting it to finance as a return invites exactly the scrutiny you do not want. Our take on whether EMV is worth using goes further into why.
7 Mistakes That Make Influencer Marketing ROI Look Worse Than It Is
- Counting only creator fees as the investment. It inflates ROI, and the correction lands badly when finance finds it.
- Calculating on revenue instead of margin. As the example showed, the gap can be elevenfold.
- Using a 7-day attribution window. Creator-influenced purchases frequently happen weeks later. Match the window to your actual purchase cycle.
- Sharing one promo code across all creators. You lose per-creator attribution entirely, and you cannot diagnose what worked.
- Ignoring code leakage. A code on a deals aggregator will show excellent ROI while telling you nothing about creator performance.
- Leaving content value out of the return. For seeding and always-on programs, it is often the largest single return line.
- Never running a holdout. Without one, you cannot distinguish sales your program caused from sales it merely got credit for. This is the gap that ends budget conversations badly.
How Brands Are Proving Influencer Marketing ROI
Meyer manages creator partnerships across five cookware brands with a lean team, in a category where people replace a cookware set once every five years. By pairing long-term ambassadors with selective one-off tests, the team hit CPMs as low as $1 while averaging $10 to $25 and lifted email click-through by 15%. One ambassador's whitelisted content doubled both CTR and video view rate, and her video pulled over a million views on Facebook and drove a 3.17x ROAS in paid. Reporting performance separately by effort, meaning seeding versus paid versus ambassadors, is what let the team defend top-of-funnel investment that does not tie neatly to a single conversion.
Veradek Outdoor set out to answer a specific question during a seasonal push: would creator content beat the brand's own evergreen creative in paid? The team activated 106 creators to produce organic content, then ran the top-performing posts as whitelisted Partnership Ads from the creators' own handles. Measured against evergreen campaigns as the control, the creator-led ads delivered a 23% lower CPA, a 41.5% higher click-through rate, and a 9.3% higher conversion rate, producing 1,406 attributed purchases and $400,000 in sales across two months at a platform-reported 9.7x ROAS. What makes those numbers defensible is the design. Veradek tested creator creative against its existing brand creative rather than against nothing, which is exactly the comparison described earlier in this guide.
Kettle & Fire runs its creator program with a two-person team, and it attributes two revenue mechanisms separately instead of reporting one blended figure. Repurposed creator content in paid drove $135,000 in sales from 2,000 pieces of content, while 612 promo codes drove another $50,000, inside a program total of roughly $200,000. Efficiency held as the program scaled to six simultaneous campaigns, with CPM under $5 and cost per engagement at $0.17. Splitting the report by mechanism is what tells a small team which lever actually produced the result, and this is the clearest demonstration here that program size and ROI are not the same thing.
The common thread across all of these success stories is that each team decided in advance which return they were accountable for and instrumented for it before launching.
How Aspire Helps You Measure Influencer Marketing ROI
Most of the work in this guide is hard because the data lives in multiple places. Affiliate revenue sits in one tool, ad performance in another, content in a Drive folder, and creator payments in a spreadsheet.
Aspire's measurement suite consolidates that into one view:
- Impact Dashboard translates your whole program into a single dollar figure, combining content value, awareness, engagement, and sales. Naturepedic reached an Impact Value of 36, meaning $36 of value for every $1 spent.
- Attribution and ROI tracking traces each dollar back to the specific creator and piece of content that produced it, connecting affiliate clicks, ad spend, and sales to source content.
- Ads and Sales dashboards report ROAS and affiliate performance down to individual content, so you can see which creative is carrying the program.
- Budget management tracks committed versus spent in real time, which keeps the investment side of your ROI calculation accurate without a month-end reconciliation.
Ready to see what your program looks like under proper measurement? Book a demo and we will walk through your numbers with you.
Frequently Asked Questions
What is a good ROI for influencer marketing?
No credible source publishes a reliable average return multiple, which is why obsolete figures like "$6.50 per $1" (2015) and "$5.78 per $1" (2019) still circulate. The best independent evidence comes from econometric modeling of 220 campaigns across 144 brands, which scored influencer marketing at 99 against an all-channel average of 100 in the short term, and at 151 over a longer horizon, roughly double paid social's 77. As a working bar, 2x on attributed margin is the floor a competent program should clear, 3x is a strong result, and anything above 5x warrants an attribution audit, since unusually high returns can sometimes mean that a promo code is absorbing credit for purchases that would have happened anyway.
How do you calculate influencer marketing ROI?
Use ROI = (Return − Investment) ÷ Investment × 100. Include every cost in the investment, including creator fees, product at COGS, shipping, usage rights, paid amplification, tooling, and loaded team hours. For the return, use contribution margin rather than revenue, so that discounts, COGS, and returns are accounted for, then add content value measured as production cost avoided.
How long does it take to see ROI from an influencer campaign?
Affiliate and promo code revenue typically appears within days of a post going live. Full ROI takes longer, because creator-influenced purchases often happen two to six weeks after exposure, and longer in considered-purchase categories. Set your attribution window to match your actual purchase cycle, generally 30 to 90 days, and expect brand-building returns to accrue over quarters rather than weeks.
How do you calculate ROI on a gifted or product seeding campaign?
The investment is product at COGS plus shipping, fulfillment, and coordination time. The return is attributed sales, plus content value calculated as the production cost you avoided, which is usually the larger line. Track post rate separately as your efficiency metric. For instance, if only 30% of recipients post, your true cost per asset is more than triple your per-unit send cost.
What is the difference between influencer marketing ROI and ROAS?
ROAS divides revenue by spend and describes gross return, so $150,000 on $50,000 is a 3x ROAS. ROI subtracts the investment first and describes profit, so the same campaign is a 200% ROI. ROAS is the faster diagnostic and ROI is what finance evaluates. Report both and label which is which.
Which influencer tier delivers the best ROI?
Nano creators generate the highest engagement by a wide margin, averaging 6.29% on Aspire platform data against 1.80% for mega creators, with micro at 5.77%, mid-tier at 4.33%, and macro at 3.71%. Engagement is not ROI, though. Running 40 nano creators takes far more coordination than running four macro creators, so factor loaded team hours into your investment line before concluding that smaller is automatically cheaper. Most marketers split the difference: 54% work primarily with nano and micro creators, and 32% now lead with mid-tier for engagement plus reach.
Why does my influencer marketing ROI look so low?
The three most common causes are a last-click attribution model that credits creator-initiated sales to paid search or retargeting, an attribution window shorter than your purchase cycle, and leaving content value out of the return entirely. A fourth is shared promo codes, which make per-creator performance impossible to isolate. Fix attribution before concluding the program is underperforming.
Do I need an incrementality test to prove influencer marketing ROI?
Attribution alone cannot tell you whether a sale would have happened anyway, so a holdout is the only way to prove incremental impact. If your volume supports it, split matched geographies, hold out 20% to 30% of the market, run for at least two purchase cycles, and measure total category sales rather than attributed sales. If it does not, a four to eight week pre-campaign baseline is a weaker but workable substitute.